Explore

Ridership and Operations

Our efforts to enhance service and operations has led to increased ridership rates surpassing pre-pandemic levels

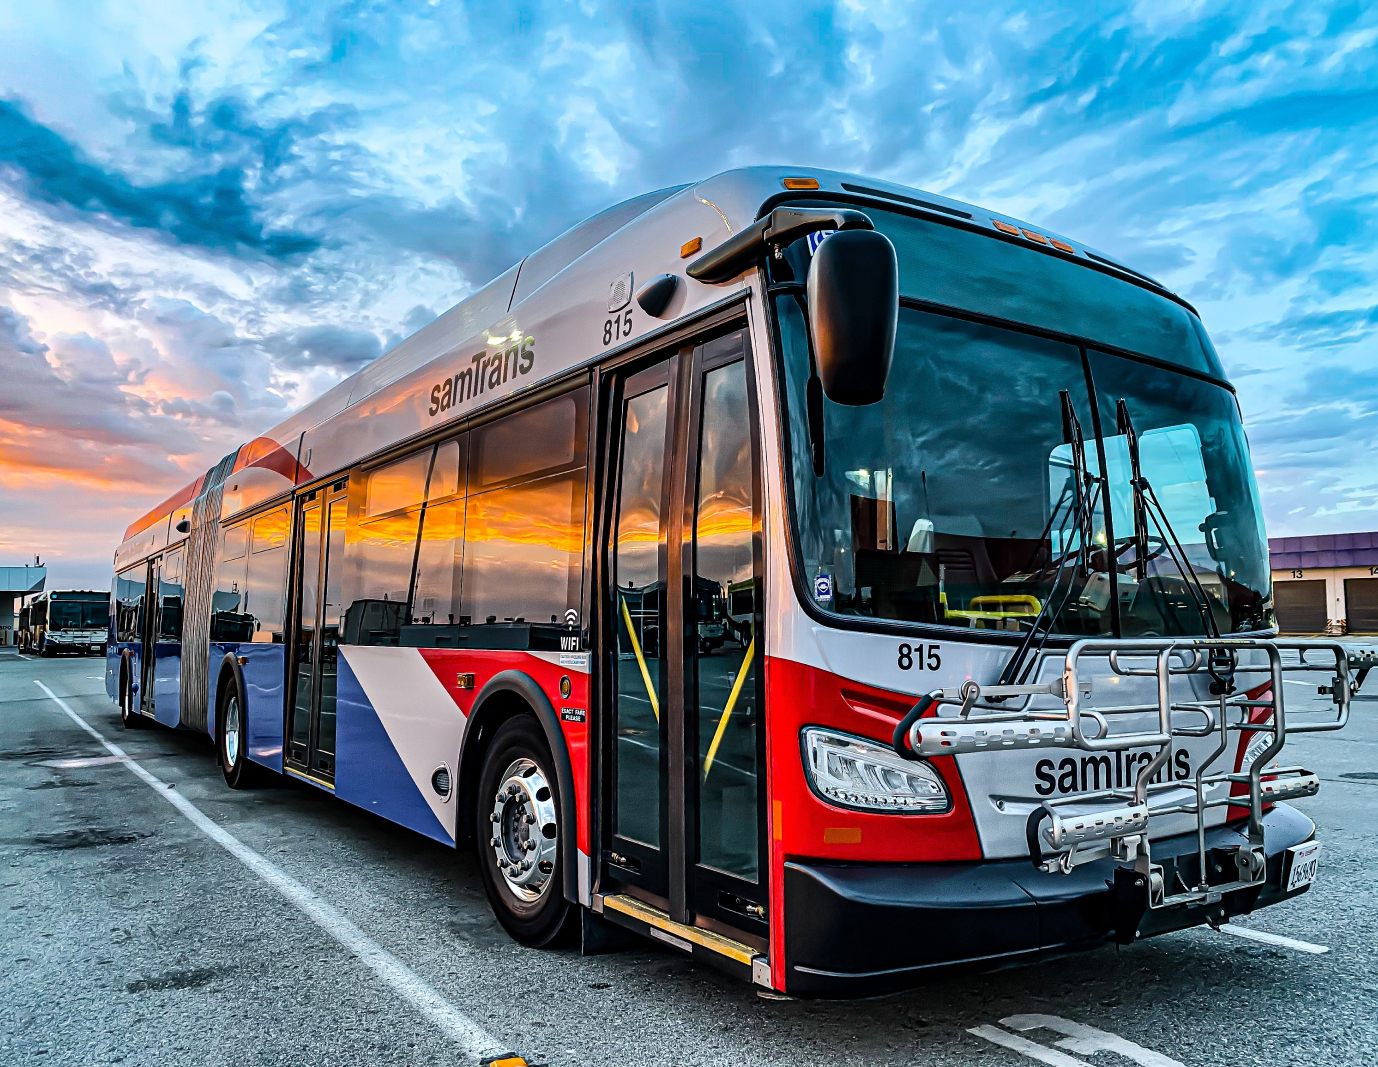
SamTrans is carrying more riders while continuing to improve service across San Mateo County. In FY2025, SamTrans provided nearly 11 million unlinked passenger trips, up from FY2024 (~10.2 million) and FY2023 (8.8 million). Fixed-route ridership on scheduled bus service increased by 7.9% compared to FY2024 as more people choose SamTrans for everyday trips to work, school, appointments, and regional connections, benefiting both riders and the communities we serve.

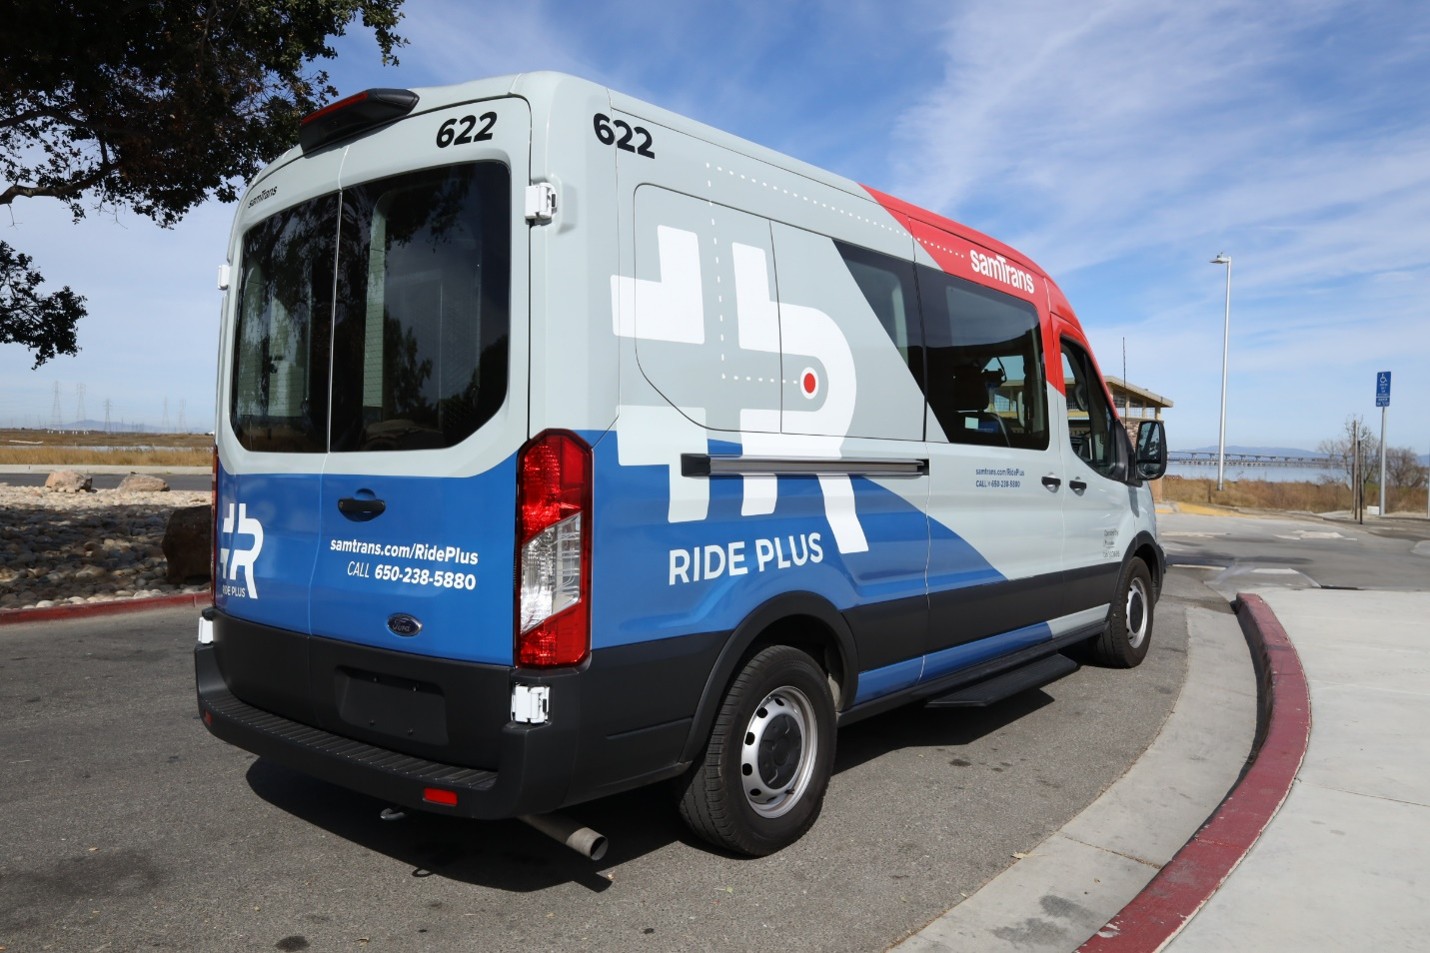
Ride Plus, SamTrans’ on-demand microtransit service, continues to gain momentum. Ridership increased by 5% in FY2025, and with expanded service areas and hours of operation shows no signs of slowing down. A transit option that’s designed around riders’ travel needs, Ride Plus provides flexible connections in communities such as East Palo Alto/Belle Haven and Half Moon Bay/El Granada.

SamTrans has also continued to expand opportunities for young riders and students. Through programs such as Youth Unlimited, SamTrans makes transit a more affordable and accessible option for youth, including students from socioeconomically disadvantaged households. These programs support greater mobility and reduce transportation barriers.

Detour: Ridership Recovery Post-COVID

Like transit agencies across the country, SamTrans experienced significant ridership impacts during the COVID-19 pandemic. Since then, riders have steadily returned from approximately 8.8 million unlinked passenger trips in FY2023 to nearly 11.0 million in FY2025, approaching pre-pandemic levels (11.2 million riders, FY2019).

This recovery has been supported by major service improvements, including the full implementation of Reimagine SamTrans, expanded Ride Plus on-demand service, and improved connections across the county.

At the same time, SamTrans began integrating zero-emission buses into its fleet. Beginning in 2023, the agency launched 17 battery-electric buses (BEBs) into revenue service, installed BEB chargers at North Base and South Base, introduced EPX express service using primarily zero-emission buses, and added 10 hydrogen fuel cell electric buses (FCEBs). In support of its fleet transition, SamTrans installed temporary hydrogen fueling equipment at North Base and continued permanent station design. Looking ahead, the Board of Directors has approved the purchase of up to 108 additional FCEBs and 20 additional BEBs, the largest zero-emission bus purchase in the agency's history.

More riders opting to ride our increasingly cleaner, zero-emission fleet will boost emission reduction efforts and benefit San Mateo County overall.

Route to recovery

21% increase in ridership from 2021 to 2025

Nearly 11 million passenger trips across all reported services in FY2025 – a 7.5% increase in total ridership over FY2024 and more than doubling FY2021’s ridership.

Go further: View Ridership Annual Data

Building on the continued recovery in ridership, the trends in Unlinked Passenger Trips (UPT), Vehicle Miles Traveled (VMT), and Passenger Miles Traveled (PMT) show how travel demand and service delivery have evolved since pre-pandemic years. UPT in FY2025 neared pre-pandemic levels while VMT exceeded these marks by 5%, reflecting expanded service associated with Reimagine SamTrans implementation. PMT remained 12% below FY2019, which may indicate changes in rider travel patterns associated with ReImagine’s strategic service restructuring.

Total Annual Unlinked Passenger Trips (UPT) [Footnote #1]

In response to COVID-19-associated risk reductions, SamTrans gradually restored service, first in August 2020 and again in January 2021. However, boardings decreased by approximately 19% between 2019 and 2020 and by 49% between 2020 and 2021

Total Annual Passenger Miles Traveled (PMT) [Footnote #2]

Passenger miles traveled (PMT) decreased by approximately 24% and 50% during these same timeframes, respectively.

Total annual samTrans Vehicle miles (Vm) [Footnote #3]

Footnotes

  1. Federal Transit Administration, National Transit Database, FY 2018 to FY 2022 Reporting - San Mateo County Transit District. (Activity from the DT/PT mode and Transportation Authority Shuttle operations are excluded from this inventory). ↩︎
  2. Federal Transit Administration, National Transit Database, FY 2018 to FY 2022 Reporting - San Mateo County Transit District. (Activity from the DT/PT mode and Transportation Authority Shuttle operations are excluded from this inventory). ↩︎
  3. Federal Transit Administration, National Transit Database, FY 2018 to FY 2022 Reporting - San Mateo County Transit District. (Activity from the DT/PT mode and Transportation Authority Shuttle operations are excluded from this inventory). ↩︎

Neighborhood Equity Index

SamTrans uses a Neighborhood Equity Index that geographically identifies neighborhoods with concentrations of households that meet the following three criteria:

  • Low-income households: Households earning less than $75,000 annually
  • Racial and ethnic minorities: Populations that identify as a race or ethnicity other than white
  • Zero-car households: Households with no access to a personal vehicle

The Equity Index produces a composite score of the above factors. The composite scores for each block group are mapped, allowing staff to spatially identify the areas of highest need, called equity priority areas. These are neighborhoods where residents are less likely to have access to a car, and more likely to work low-wage jobs or identify as people of color. Mapping these areas helps staff understand and prioritize service in areas of highest transportation need. SamTrans also uses this equity framework to help inform and prioritize where to deploy zero-emission bus service, ensuring that the communities with the greatest transportation needs are among the first to benefit from cleaner, quieter transit operations.

Child riding in a replica SamTrans bus next to a real SamTrans bus

Reimagine SamTrans – Fully Implemented

ReImagine SamTrans is the District’s comprehensive effort to modernize bus service and better match today’s travel needs. The project began in 2019 and was fully implemented by August 2024, bringing more convenient, flexible, and reliable service to riders across San Mateo County.

From Phase One through Phase Four of ReImagine, SamTrans increased in-service hours by 12%, expanded the bus operator workforce by 15%, increased service frequency on 15 routes, and added Ride Plus on-demand service in East Palo Alto/Belle Haven and Half Moon Bay/El Granada.

ReImagine SamTrans also brought bus service to new destinations, expanded service to more times and days of the week, and strengthened connections to schools, jobs, transit hubs, and community destinations. These improvements make SamTrans a more compelling option for more riders and support the District’s broader sustainability goals by encouraging more people to choose transit.

Enhanced Service Frequency

SamTrans increased service frequency on Routes 110, 120, 141, 250, 260, 276, 278, 292, 296, and FCX, reducing wait times and improving convenience for riders.

New Weekend Service

Routes 276 and 295 now operate on Saturdays and Sundays, while Routes 251 and 260 now include Sunday service, giving riders more options throughout the week.

New Routes

SamTrans added Routes CSM and SKY to better serve students traveling to College of San Mateo and Skyline College, as well as Route 142, to serve areas previously covered by Routes 140 and 141.

Returned Route

Express Route PCX, formerly Route 118, returned with new routing between Linda Mar Park and Ride and Daly City BART.

Salesforce Transit Center

Routes 292, 397 OWL, FCX, and EPX now directly serve the Salesforce Transit Center in San Francisco, strengthening regional connections and improving the rider experience.

Consolidated Routes

SamTrans consolidated several routes to streamline service, and combined school-oriented routes to expand neighborhood access to schools.

Home

Where to Next?

Air Quality